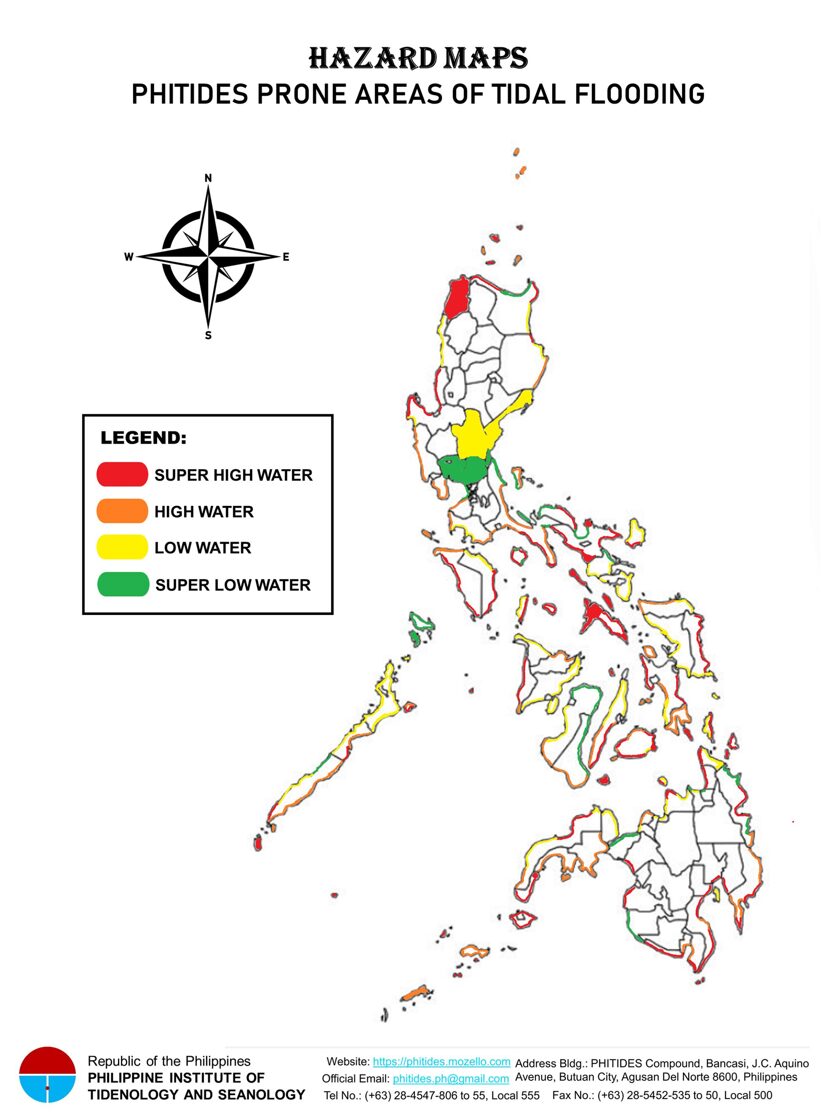
Hazard Maps
The Hazard Maps is the map for the tidal flooding economies and known for everything about the ocean of the Philippines from these continents of hazard maps and helps you find out where are the majors of tidal flooding is located and the physical divisions to be updated, alerted and warned. The map indicates to show all of the color coded track lines are the main coastal of flooding with different levels of the water.
The map also known for monitoring and measuring the most high parts of seawater however, the location of the flood has a profound effect on the sea temperature. For instance, the surface water temperature of the track lines inshore or offshore the outline will be manage of high resolution or customized the map with the real main affected areas.
The beach in all areas of the track lines are formed and get back to the tidal range such as high floods with strong waves and other water disturbance. It also has a map control that makes the prone areas be cleared to monitor. Largest water waves on the ocean is the reason you’ll find a wide array of a saltwater and can also be completely landlocked. The most famous example of a flood is that the location are right and real time of measuring the water and can also completely manage good.
There are other instances of landlocked in the ocean and they are the floods on coastal area and can have a wide range of sizes, locations, and temperatures. The floods is defined as a portion of the ocean that is partly can bring a huge disaster. It can be large and strong as the waves of the sea and it also bring a tidal range such as tides, seas, waves, floods and other water disaster will occur accurately.